Front page / Data desk Real sources. Figures come from the official datasets linked in each report.
Visible timeframes. Monthly records and rolling windows answer different questions.
Room for uncertainty. Revisions and incomplete observations stay visible.
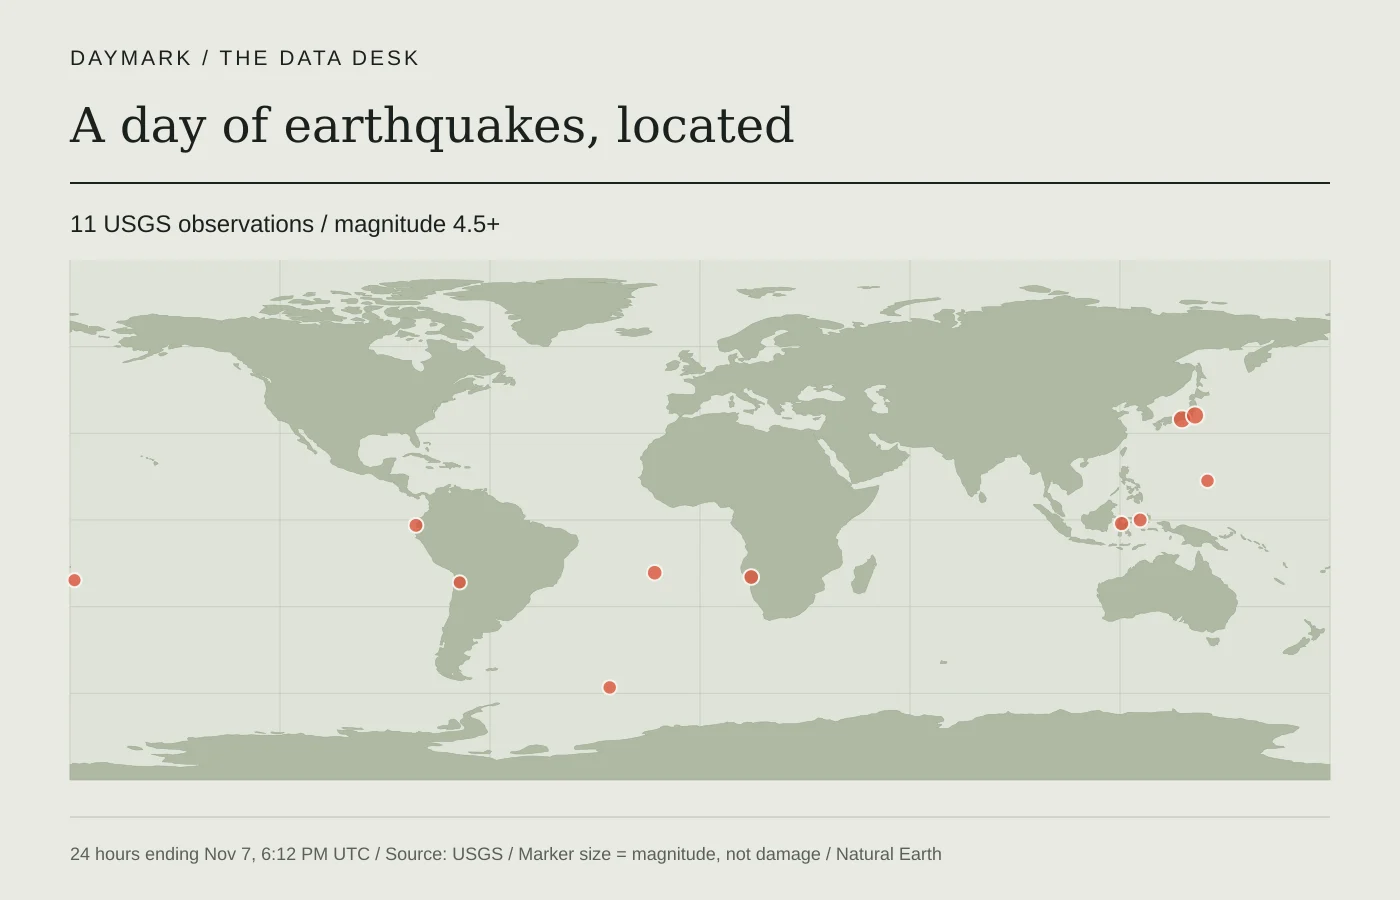
Daymark's November 7, 2026 earthquake briefing, with official USGS event records, locations, magnitudes, and an explanation of what the measurements show.
Source USGS: Magnitude 4.5+ earthquakes, past day
Report updated Nov 7, 2026
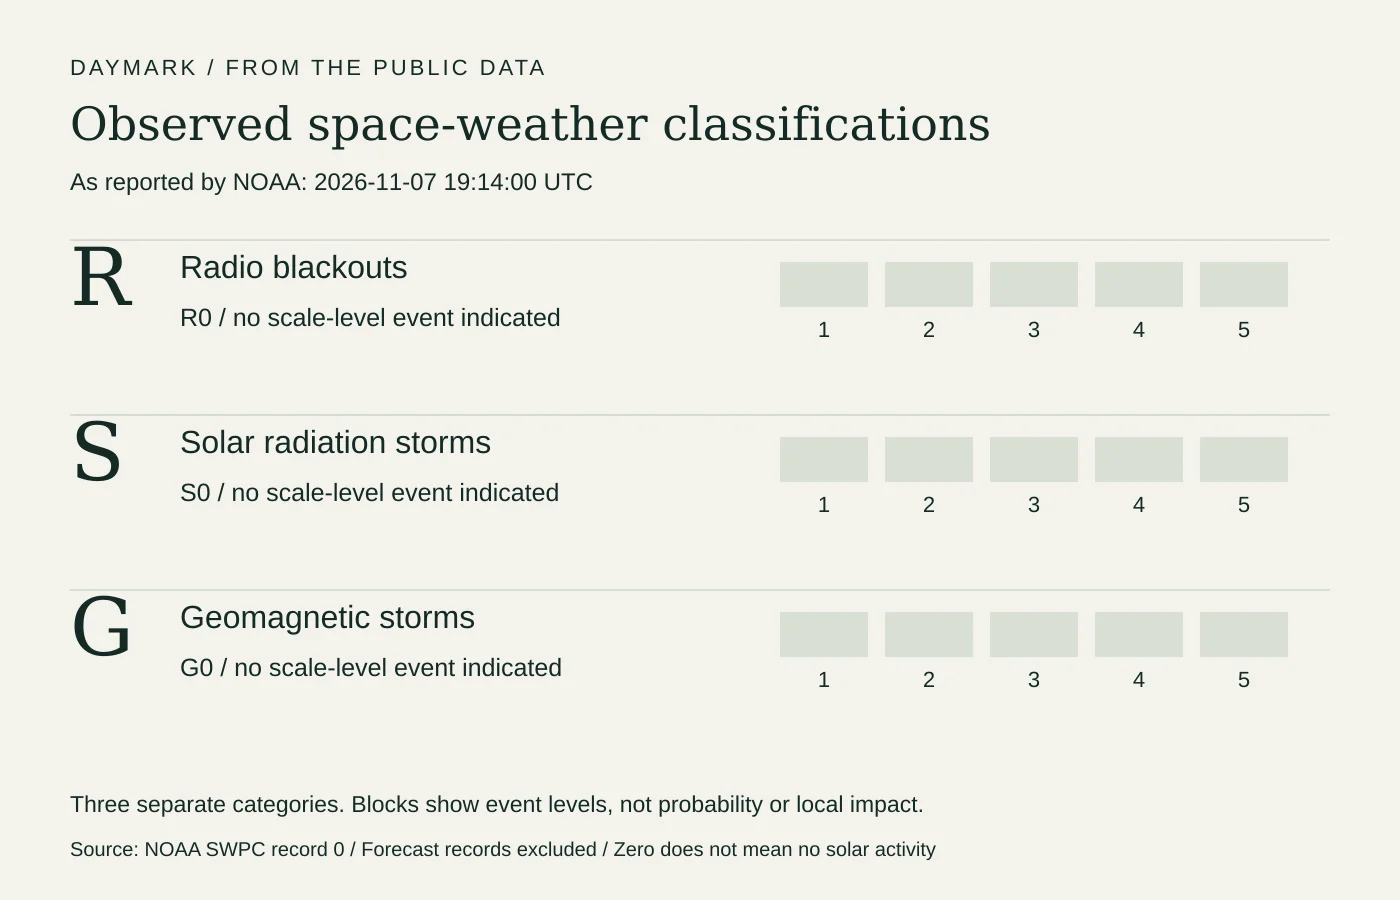
Observation period 2026-11-07 Read the complete briefing ↗ A source-timed explanation of NOAA’s three observed space-weather scales, with separate classifications and no forecasts presented as events.
Source NOAA SWPC: current scales JSON (record 0)
Report updated Nov 7, 2026
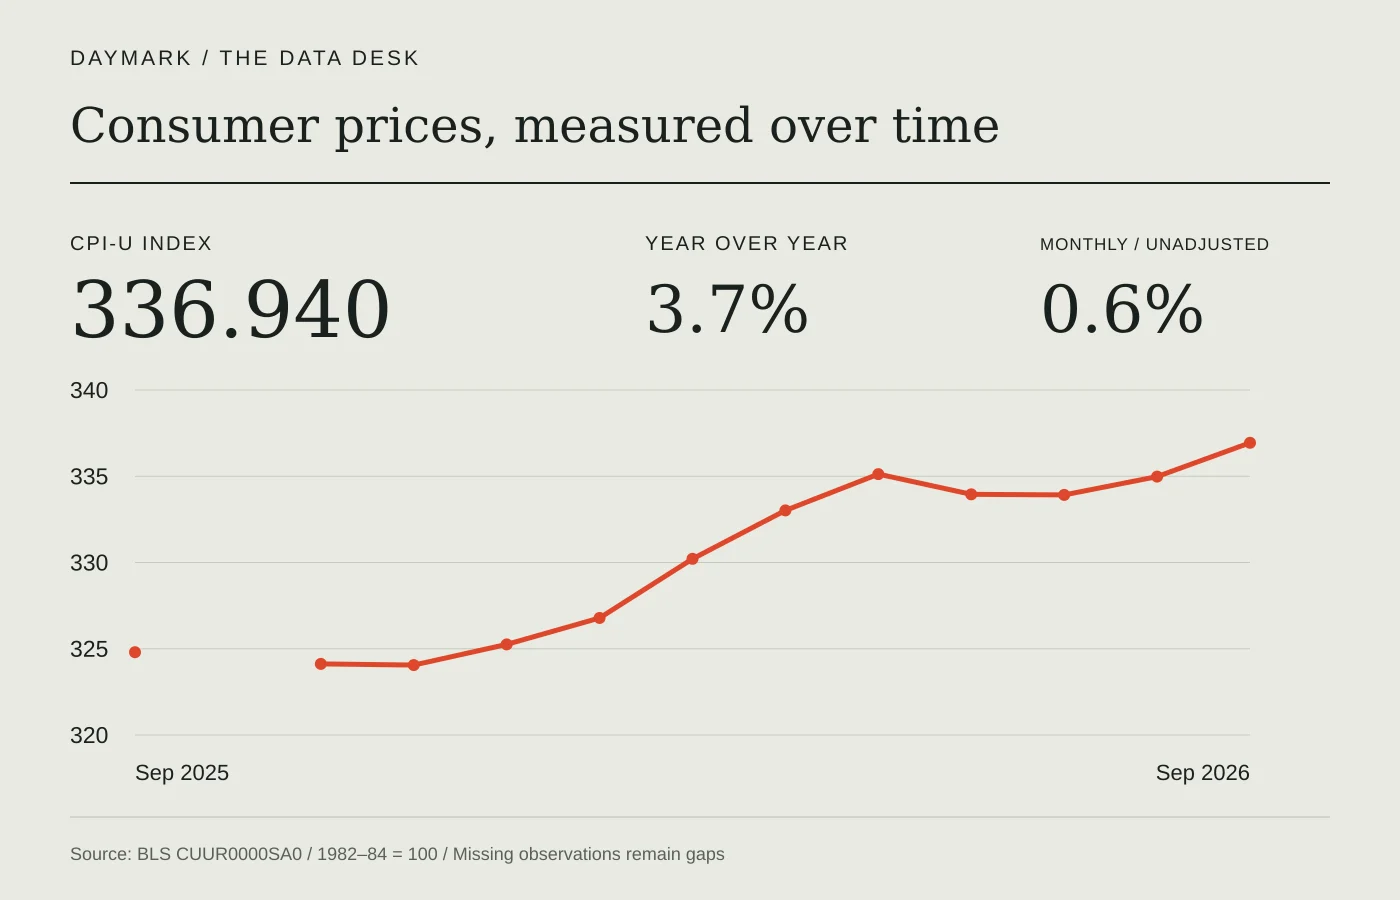
Observation period 2026-11-07T19:14:00Z Read the complete briefing ↗ A complete Daymark briefing on September 2026 U.S. consumer prices, with annual and monthly comparisons calculated from official BLS data.
Source BLS: CUUR0000SA0, all-items CPI-U index
Report updated Nov 7, 2026
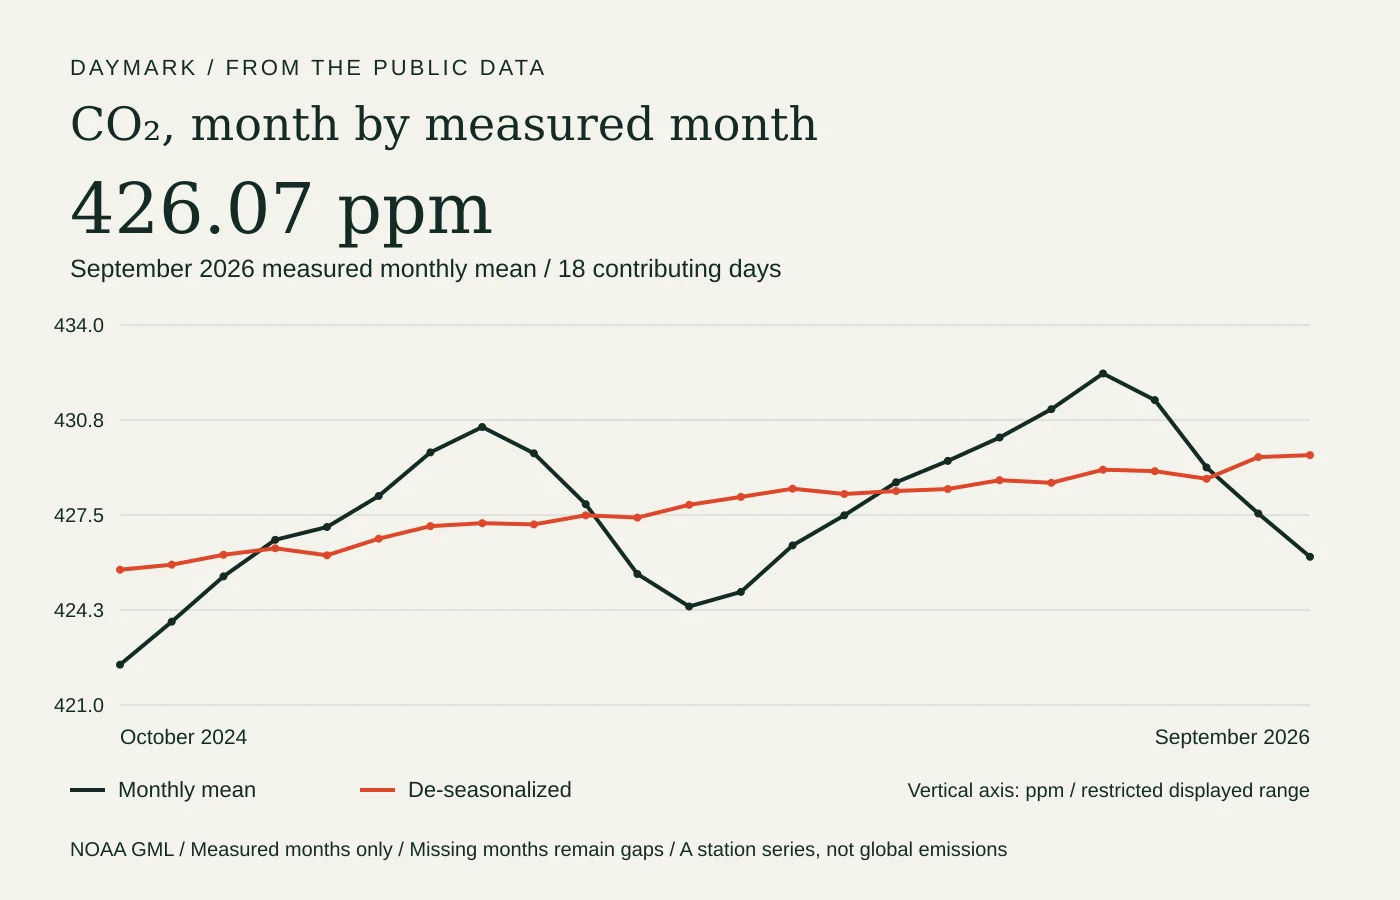
Observation period 2026-09 Read the complete briefing ↗ September 2026 measured monthly CO₂ was 426.07 ppm. A complete briefing on comparisons, seasonality, sampling, and the source’s limitations.
Source NOAA GML: Mauna Loa monthly mean CO₂ data and file notes
Report updated Nov 7, 2026
Observation period 2026-09 Read the complete briefing ↗ Reports refresh as sources change. If a source fails, the last valid report remains available with its original update date. Use the period inside the report when deciding how current a measurement is.
Read our editorial standards ↗