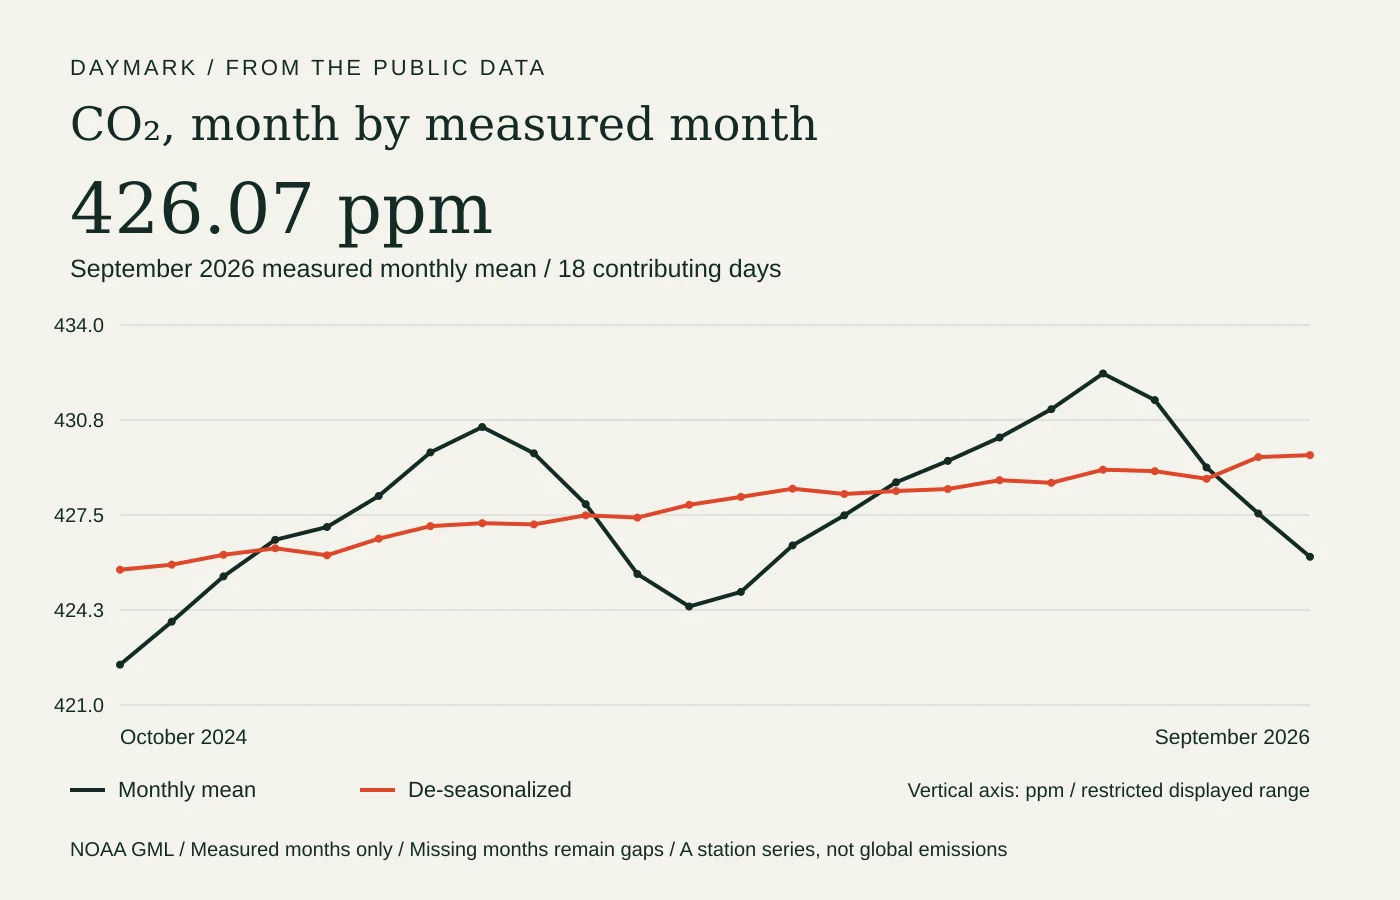
The latest measured month in this file
The latest usable measured monthly observation in NOAA's Mauna Loa carbon-dioxide file is September 2026. Its monthly mean is 426.07 parts per million, and the accompanying de-seasonalized value is 429.55 ppm. The source row reports 18 days contributing to the monthly calculation, a standard deviation of 0.51 ppm, and uncertainty of the monthly mean of 0.23 ppm. These fields describe the source observation, not the date when this website was refreshed.
Parts per million expresses the dry-air mole fraction: approximately how many carbon-dioxide molecules occur per million molecules of dry air. A concentration of 426.07 ppm is not a daily temperature, a mass of carbon emitted, or an air-quality recommendation for someone's home. This is a background atmospheric record associated with an observing site in Hawaii. It should not be relabeled as the concentration at every city, or as a global mean that this particular file does not supply.
Two comparisons, with their units intact
The preceding measured month, August 2026, was 427.55 ppm. Subtracting that value from 426.07 ppm gives -1.48 ppm. This is a difference in concentration, not a percentage and not a measurement of emissions. It uses the unadjusted monthly means, which retain seasonal variation.
The corresponding month a year earlier, September 2025, was 424.37 ppm. The same-month comparison is therefore 426.07 minus 424.37, or +1.70 ppm. Comparing the same calendar month reduces one source of seasonal mismatch, but it does not remove all short-term variability or turn this station reading into a global emissions total.
Why the two curves are different
The monthly-mean column retains the recurring seasonal cycle. The de-seasonalized column removes an estimated seasonal component, allowing readers to inspect another view of the underlying record. Those are two treatments of the same source series, not two separate observatories. The difference between them is not automatically a measurement error. This page labels both curves and uses only monthly means for the preceding-month and preceding-year subtraction, so the calculation does not mix adjusted and unadjusted values.
A lower unadjusted concentration from one month to the next does not by itself show that human emissions fell during that month. Atmospheric concentration reflects the balance of additions and removals, transport, and seasonal exchange as well as emissions. Likewise, one positive monthly difference does not establish that a particular policy failed or that the long-term rate is accelerating. To investigate trends, use multiple comparable periods and the broader NOAA datasets rather than assigning a cause to a single step in this line.
How this measured record is selected
NOAA constructs its monthly means from daily means and corrects monthly values to the center of the month using the average seasonal cycle. The source's day count therefore deserves attention: a monthly average is not necessarily based on a valid observation on every calendar day. The reported standard deviation describes variation among contributing daily means; it is not the same field as uncertainty of the monthly mean. This article reports both without treating either number as a guaranteed upper limit on future changes.
The file also contains historic rows with missing metadata and interpolated months. Its comments identify estimated NOAA months using negative standard deviation and uncertainty, while early Scripps rows can have negative metadata because those details are unavailable. This briefing excludes such rows from its measured comparisons and diagram rather than drawing an estimated value as an observed point. If a comparison month is unavailable, the text says so. The plot also breaks a line across missing calendar months instead of quietly bridging the gap.
Site history and update limits
The source notes that Mauna Loa measurements were suspended following the volcano's November 2022 eruption and resumed in July 2023. Observations from December 2022 to July 4, 2023 came from the Maunakea Observatories site nearby. That history belongs with the series: a label reading Mauna Loa is not permission to erase a documented change in the observing location. NOAA's methodology and source comments provide the authoritative account of how the record is maintained and revised.
This is a monthly briefing, even though the website checks for an updated file automatically. NOAA offers other products for daily and hourly conditions; those measurements are not imported here. The latest complete period in this dataset can lag the current calendar month, and the page must keep that period visible. Unchanged measurements retain the article's generation date. New or revised validated observations update it; a failed request preserves the last valid report. Use the linked NOAA data and methods to check revisions, broader comparisons, and the source's latest publication.
Go to the sources
- NOAA GML: Mauna Loa monthly mean CO₂ data and file notes
- NOAA GML: Mauna Loa trends and methods
- NOAA GML: how background CO₂ is measured
Our editorial standards explain how sources and automated briefings are handled.