Read the label before the number
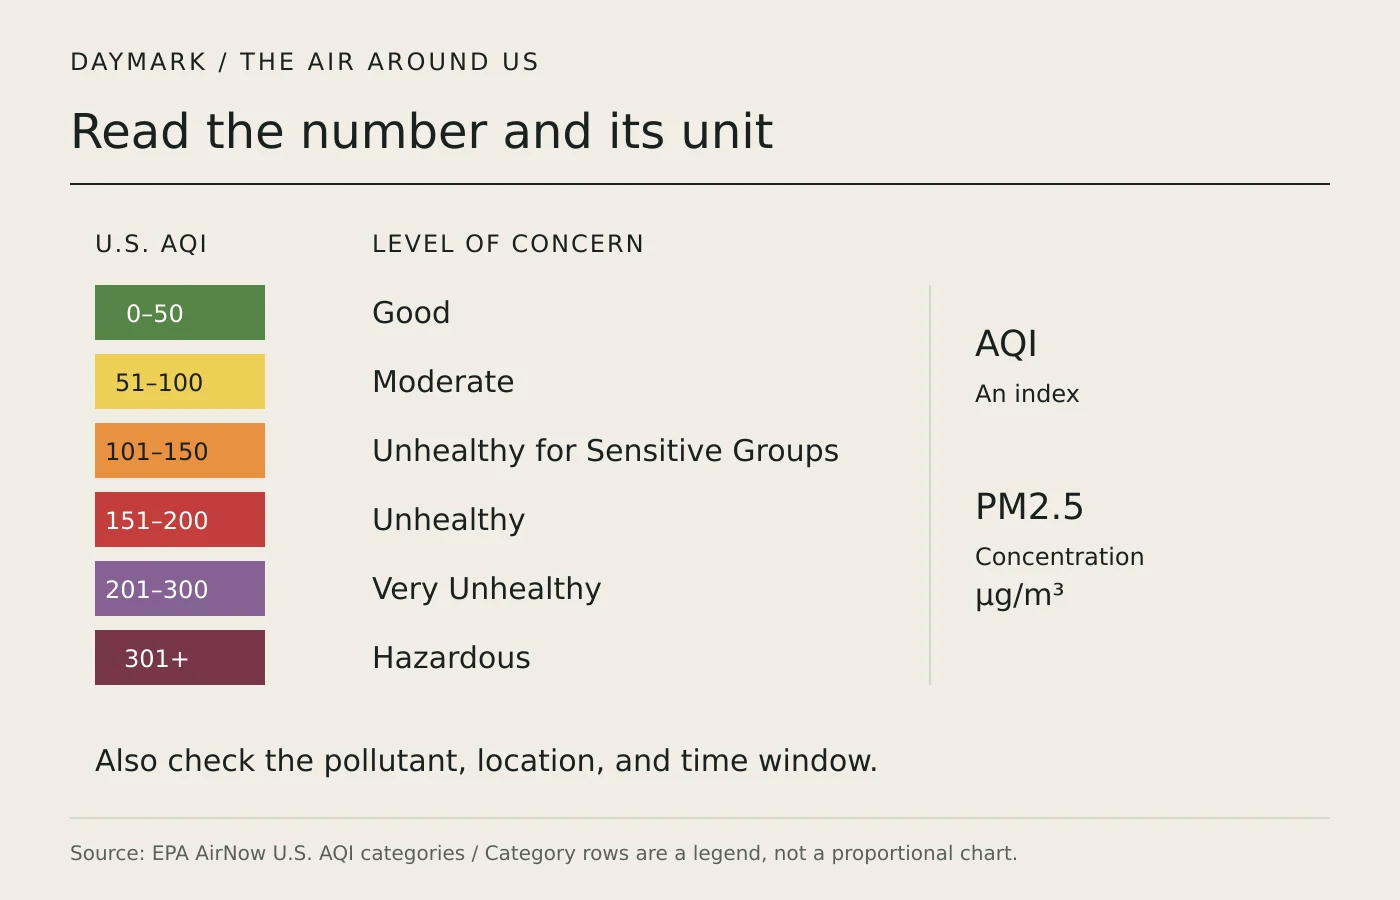
Two air-quality apps can show different numbers without measuring exactly the same thing. The U.S. Air Quality Index is EPA's system for communicating outdoor air pollution and related health concerns. PM2.5, by contrast, describes fine particle pollution. A PM2.5 concentration and a PM2.5 AQI are different quantities. Before comparing them, check whether the display gives an index value or a concentration with units.
Concentration is commonly expressed as micrograms per cubic meter of air. The AQI converts pollutant concentrations into an index with defined categories; it is not a percentage and does not use those concentration units. A reading of 100 does not mean the air is one hundred percent polluted. Nor does doubling an AQI value establish that a person's health risk has doubled. Use the category and its associated guidance.
The U.S. scale has six categories
AirNow lists Good as 0–50, Moderate as 51–100, Unhealthy for Sensitive Groups as 101–150, Unhealthy as 151–200, Very Unhealthy as 201–300, and Hazardous as 301 or higher. Higher values indicate greater health concern. The words matter as much as the color, particularly for readers who cannot distinguish the colors easily or are seeing the display without its legend.
The index covers ground-level ozone, particle pollution, carbon monoxide, sulfur dioxide, and nitrogen dioxide. A location's displayed headline value can reflect the pollutant with the highest index. Inspect which pollutant drives that value before calling every high AQI reading a smoke event. Particle pollution and ozone can require different explanations, and the most relevant sensitive groups or activity guidance can depend on the pollutant involved.
What the 2.5 in PM2.5 describes
EPA describes PM2.5 as fine inhalable particles generally 2.5 micrometers or smaller in diameter. Particle pollution is a mixture of solids and liquid droplets, rather than a single chemical. Some particles are emitted directly, including from fires; others form in the atmosphere through reactions involving pollutants from sources such as industry and vehicles. The size label does not identify one source or composition by itself.
Fine particles matter because they can penetrate deep into the respiratory system and are associated with serious health effects. The precise exposure also depends on time and activity. A single outdoor monitor reading does not measure every person's inhaled dose or the air inside every building. Use the observation to understand local conditions and consult the official guidance appropriate to your circumstances, rather than converting it into an individual diagnosis.
Current conditions and a daily average differ
AirNow's current AQI uses a NowCast calculation for ozone and particle pollution. It combines multiple hours of observations to describe the most current hour available. During stable conditions it uses longer averaging; when conditions change rapidly it puts more emphasis on recent observations. A NowCast is therefore not simply a raw instantaneous sensor measurement, even though it is intended to help people act on current conditions.
A forecast answers a different question: what pollution is expected over the forecast period. AirNow explains that particle forecasts describe an average twenty-four-hour concentration, while ozone forecasts concern the period of highest expected eight-hour concentrations. A current reading, a completed daily measure, and tomorrow's forecast can legitimately differ. Check the timestamp and averaging period before treating the difference as evidence that one service is wrong.
Location and measurement method affect a comparison
Pollution can vary across a reporting area, and a reading can change during the day. An observation for a city, a particular monitor, or an estimated map cell does not necessarily represent the same place. Keep the location label and timestamp visible when sharing a screenshot. If a display has not updated, describe its age rather than silently presenting it as the conditions someone will encounter now.
AirNow's Fire and Smoke Map combines several data types, including permanent monitors, temporary monitors, and sensor information. Check the map's explanations when comparing its markers. Different countries also operate different air-quality index systems, so equal AQI numbers from two national systems need not represent equal concentrations. For a cross-border comparison, use the stated system and compatible concentration measurements instead of matching the index labels by appearance alone.
Turn the reading into a useful plan
Open the local official forecast or current display, identify the pollutant, and read the guidance attached to its category. Use forecast discussions to plan the timing of outdoor activity, then recheck conditions if they are changing. AirNow's activity guides give practical advice for different pollution levels and groups. People with relevant medical conditions can also discuss a personal plan with a clinician, since a general index does not know their history.
When explaining a reading to someone else, include four details: the value and system, the pollutant, the place, and the time window. Keep any proposed action aligned with the official guidance rather than inventing a universal threshold for every person. This produces a useful air-quality update that distinguishes measured conditions from a forecast and helps readers understand why their own location or circumstances may call for a different response.
Go to the sources
- EPA AirNow: U.S. AQI basics and categories
- EPA AirNow: Using forecasts and the NowCast AQI
- EPA: Particulate matter basics
- EPA AirNow: How to use this site and its maps
- EPA AirNow: Activity guides
Our editorial standards explain how sources and automated briefings are handled.