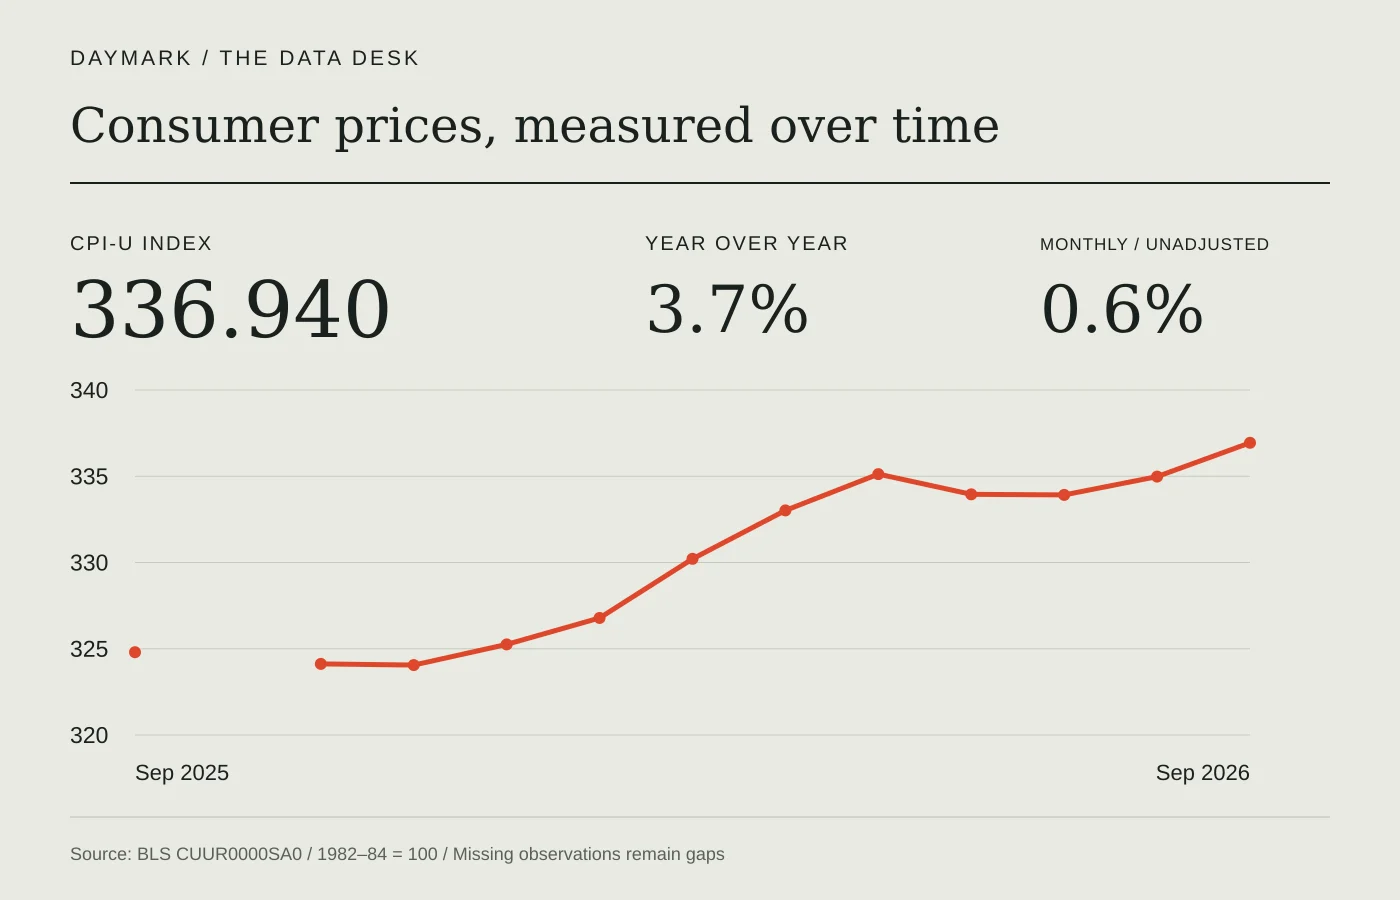
The numbers behind the story
Sep 2026- Year over year
- 3.7%
- Month over month
- 0.6%
- CPI-U index
- 336.940
Not seasonally adjusted. Reference base: 1982–84 = 100. Monthly and annual changes describe different intervals.
View the source observations
| Observation month | Index |
|---|---|
| Sep 2025 | 324.800 |
| Oct 2025 | Not published by BLS |
| Nov 2025 | 324.122 |
| Dec 2025 | 324.054 |
| Jan 2026 | 325.252 |
| Feb 2026 | 326.785 |
| Mar 2026 | 330.213 |
| Apr 2026 | 333.020 |
| May 2026 | 335.123 |
| Jun 2026 | 333.952 |
| Jul 2026 | 333.918 |
| Aug 2026 | 334.980 |
| Sep 2026 | 336.940 |
The latest monthly observation returned by the Bureau of Labor Statistics API in this update is September 2026. The all-items Consumer Price Index for All Urban Consumers, covering the U.S. city average, was 336.940. Using the same unadjusted series throughout, consumer prices were 3.7 percent higher than in September 2025. Daymark calculates this comparison from the published index levels; it is not a separate survey of prices.
The annual calculation compares 336.940 in September 2026 with 324.800 in September 2025. Dividing the newer value by the older one, subtracting one, and multiplying by 100 gives 3.738 percent before rounding. The displayed annual figure is rounded to one decimal place. Index points and percentages are different units, so simply subtracting the two index readings would not give the percentage inflation rate.
For the shorter comparison, the index in August 2026 was 334.980. Prices were 0.6 percent higher than in that preceding month. This is an unadjusted month-to-month calculation. It includes recurring seasonal patterns and must not be described as the seasonally adjusted monthly change commonly highlighted in inflation coverage. The annual and monthly figures here also describe different time spans; the monthly percentage is not an annual rate.
A small rescaling helps make the annual comparison easier to read. Set the September 2025 index to 100 and preserve the ratio between the two observations. The September 2026 reading then becomes 103.74. This is an illustrative comparison of the national index, not a claim that an individual household's $100 shopping basket now costs that amount. Actual budgets depend on the goods and services each household buys and the prices it encounters.
The current national price level is higher relative to the same month a year earlier. That comparison alone does not establish whether inflation is accelerating or slowing: answering that question requires comparable rates across several periods. Nor does it show that every item moved in the same direction. Housing, groceries, transport, and other parts of the basket can follow different paths while contributing to one all-items reading.
CPI-U describes price movement for the urban consumer population. It does not measure investment returns, a person's wages, or the price of an identical purchase at every store. A household spending a large share of its income on rent can experience pressure that the average does not fully describe. To understand a particular expense, examine the relevant BLS category data alongside the all-items figure rather than treating this one number as a complete account of living costs.
The source series uses the reference base 1982–84 = 100. An index reading of 336.940 is therefore not a dollar price. Its main use here is comparison with another observation from the same series. Mixing a different geographic area, a core index excluding food and energy, or a seasonally adjusted series into the calculation would change the question being answered.
Keep the observation month separate from the date this page was checked. The figures describe September 2026; the site's retrieval timestamp is only when the API was read. BLS publishes monthly observations on its release schedule, so a daily refresh does not create daily CPI measurements. The API can lag a release or later supply corrected data. This page retains the last valid data when retrieval or validation fails, and the labeled data period remains visible.
The table accompanying this briefing lists the available index observations used for the recent series, with exact preceding-month and preceding-year values included. Gaps are not interpolated. Use the linked BLS series and official release for category detail, seasonal comparisons, methodology, and any subsequent corrections. This is an automated, reproducible explanation of public data, not eyewitness reporting, a forecast, or personal financial advice.
Go to the sources
- BLS: CUUR0000SA0, all-items CPI-U index
- BLS: Current Consumer Price Index release
- BLS: CPI questions and answers
- BLS: Seasonal adjustment in the CPI
Our editorial standards explain how sources and automated briefings are handled.