One release, two sets of questions
The monthly U.S. Employment Situation report can produce headlines that seem to disagree: employers added jobs, yet unemployment rose. Start with the measurement rather than choosing which headline to believe. The Bureau of Labor Statistics combines the Current Employment Statistics survey of employers with the Current Population Survey of households. They are designed for different purposes, so their results are not required to move in lockstep.
The establishment survey, also called the payroll survey, measures nonfarm wage and salary jobs, hours, and earnings. The household survey classifies people as employed, unemployed, or outside the labor force, with demographic detail. The unemployment rate comes from the household survey. A payroll gain cannot be subtracted directly from the number of unemployed people as though both numbers came from one complete register.
A job and a person are different units
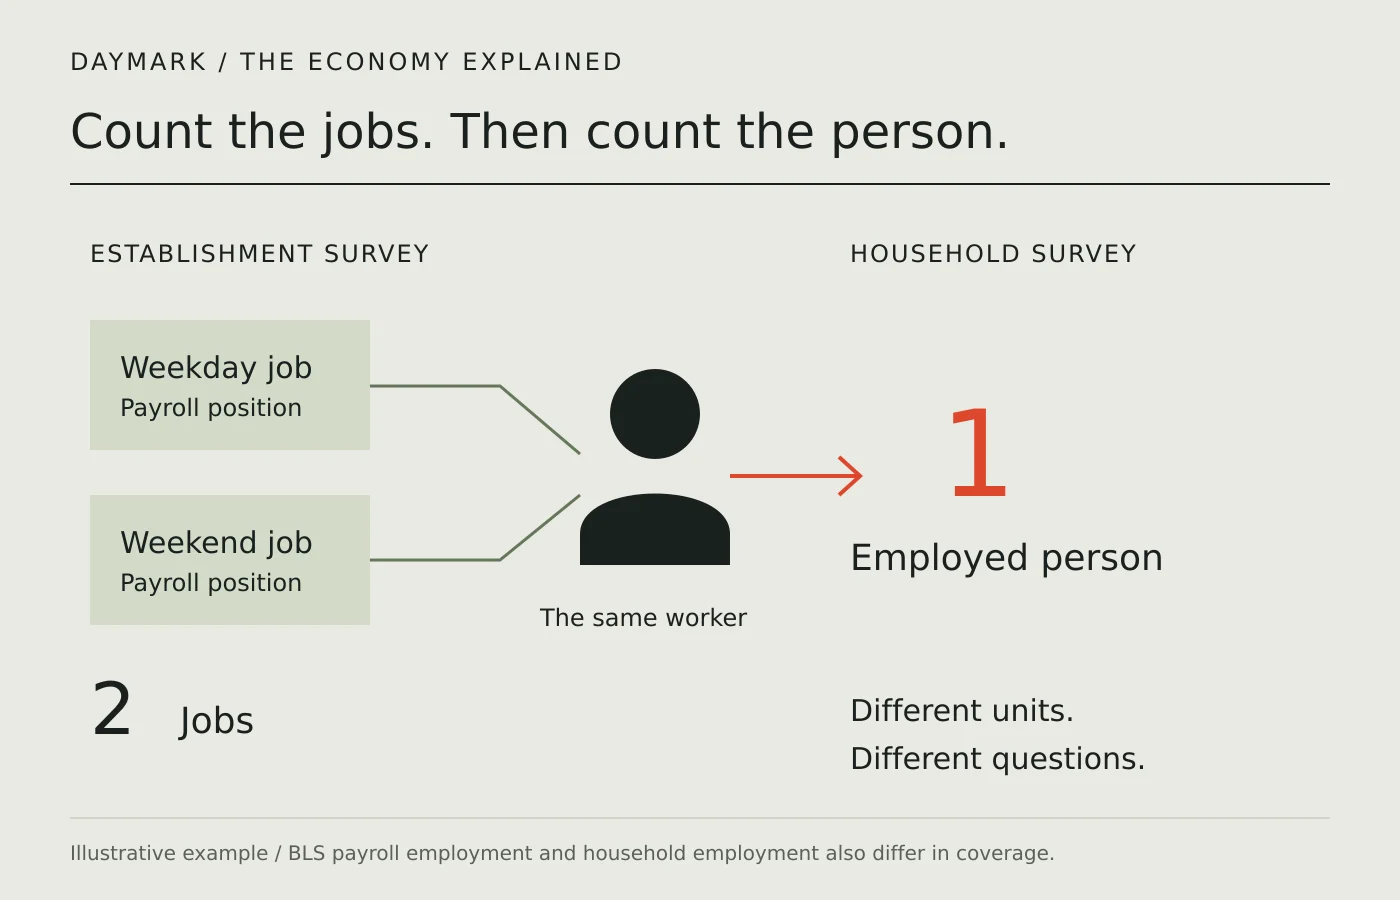
Consider an illustrative worker who holds a weekday payroll job and a second weekend payroll job. The establishment survey can count two jobs, while the household survey counts one employed person. That difference is useful: one measure describes employers' staffing, while the other describes people's employment status. Neither is wrong simply because the units differ. Always identify the unit before calculating a percentage or comparing totals.
Coverage differs as well. The household measure includes categories such as agricultural workers and people running unincorporated businesses that are outside the nonfarm payroll measure. The surveys also use different reference periods: generally the week containing the twelfth for households and the employer's pay period containing the twelfth for payrolls. A pay period may span more than one week. These details help explain temporary divergence.
Read the unemployment denominator
For the headline rate, the labor force consists of employed and unemployed people. BLS generally classifies someone as unemployed when they have no job, have actively sought work within the preceding four weeks, and are available to work. People expecting recall from temporary layoff have a specified exception to the search requirement. Someone without a job is therefore not automatically counted in the headline unemployment total.
An illustrative labor force of 100 people with four unemployed has a four percent unemployment rate. If five additional people begin looking for work and none has yet found a job, the denominator and numerator both change. The rate can rise even while other people gain jobs. Conversely, a falling rate can accompany people leaving the labor force. Check participation and the employment-population ratio before interpreting direction alone.
A monthly estimate has uncertainty
Both surveys use samples rather than interviewing every household or collecting every payroll immediately. Their estimates therefore have sampling uncertainty, alongside other possible measurement errors. BLS reports that the payroll survey has a smaller margin of error for monthly employment change than the household survey. A small one-month movement is less persuasive than a consistent pattern supported by several related measures.
That does not mean a surprising household result can simply be discarded. Its broader scope and information about labor-force entry answer questions the payroll survey cannot. Look at several months, the stated uncertainty, and the reasons given in the documentation. Avoid declaring that one survey disproves the other solely because their latest changes have opposite signs. The comparison needs matched concepts and enough time to judge a trend.
Revisions are part of the measurement
Initial payroll estimates are revised in the next two releases as additional employer reports arrive and seasonal factors are recalculated. An annual benchmark anchors the series to more complete employment counts, mainly from unemployment-insurance tax records. These are different revision processes. An updated estimate can alter the recent trend, so retain both the release date and the month being measured when discussing a revision.
Seasonal adjustment removes estimated recurring patterns, such as holiday hiring, to help compare consecutive months. An unadjusted total answers a different question. Keep adjustment consistent across a comparison and consult the table notes. The payroll system also models the net contribution of newly formed and closing businesses that cannot immediately enter the sample; the existence of a model is a reason to inspect its documentation, not proof of fabricated jobs.
Build a better reading routine
Open the official release and write down the reference month, payroll change, unemployment rate, participation rate, and revisions to preceding months. Then examine the industries behind the payroll movement. A national gain can be concentrated in particular sectors, while others contract. Keep job counts separate from hours and earnings: a staffing increase alone does not describe every change in the amount or quality of work.
Finally, match the report to the question you actually have. Employers' staffing changes call for payroll detail. Whether more people are finding work or entering the job search calls for household measures. Your own job prospects also depend on occupation and location, which a single national number cannot settle. Reading the release as several related measurements makes it useful without turning it into a prediction about an individual household or investment.
Go to the sources
- BLS: Comparing household and payroll employment
- BLS: How the government measures unemployment
- BLS: Employment Situation frequently asked questions
- BLS: Quick guide to methods and measurement issues
Our editorial standards explain how sources and automated briefings are handled.